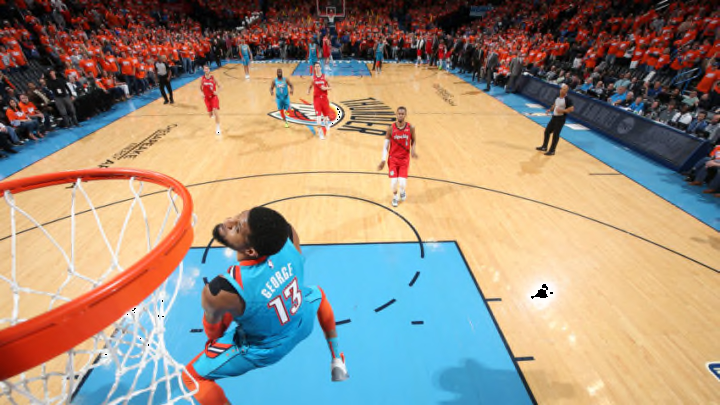
Comparing George’s stats:
Prior to the injury, Paul George was having a career season. He was among the trio (Giannis Antetokounmpo and James Harden) most frequently discussed as candidates to win the Most Valuable Player Award. In fact, he was building momentum in that discussion as his numbers kept improving monthly.
Likewise, his two-way efforts also had him earning praise and consideration to win Defensive Player of the Year.
Season:
| Season | MP | FG% | 3P | 3PA | 3P% | 2PA | 2P% | eFG% | TRB | AST | STL | PTS |
|---|---|---|---|---|---|---|---|---|---|---|---|---|
| 2018-19 | 36.9 | .438 | 3.8 | 9.8 | .386 | 11.1 | .484 | .529 | 8.2 | 4.1 | 2.2 | 28.0 |
| Career | 33.8 | .433 | 2.4 | 6.3 | .378 | 9.2 | .470 | .509 | 6.4 | 3.3 | 1.8 | 19.8 |
Provided by Basketball-Reference.com: View Original Table
Generated 4/21/2019.
The shoulder injury in all likelihood cost him earning either award, but his season was no less impressive as he showcased precisely how deadly he and Westbrook as a tandem could be.
Versus Blazers this season:
In the four games against the Blazers during the regular season, Paul George shot the lights out. He averaged 38 points, 5.5 assists, 10.5 rebounds, and 2.75 steals. In the last game his efficiency from deep was off, but the injury was likely a factor at that point in the season. Even including his 1 for 9 perimeter lapse in the March 7th game George still averaged 44.5 percent from deep (44.8 percent from the field).
George’s aggressiveness was obvious based on the number of trips he had to the line. He averaged 15.5 free throws with his fewest attempts (11) occurring in the teams first meeting on February 11th.
| Rk | Date | FGA | FG% | 2P% | 3P | 3PA | 3P% | FTA | FT% | TRB | AST | STL | PTS | GmSc |
|---|---|---|---|---|---|---|---|---|---|---|---|---|---|---|
| 1 | 2019-02-11 | 26 | .577 | .538 | 8 | 13 | .615 | 11 | .818 | 12 | 10 | 2 | 47 | 43.4 |
| 2 | 2019-01-04 | 23 | .435 | .357 | 5 | 9 | .556 | 14 | .857 | 8 | 2 | 1 | 37 | 25.5 |
| 3 | 2019-01-22 | 21 | .476 | .467 | 3 | 6 | .500 | 15 | .867 | 8 | 4 | 5 | 36 | 32.4 |
| 4 | 2019-03-07 | 23 | .304 | .429 | 1 | 9 | .111 | 20 | .850 | 14 | 6 | 3 | 32 | 25.9 |
Provided by Basketball-Reference.com: View Original Table
Generated 4/21/2019.
Series Totals:
Diving into the series, through three games George’s numbers pale in comparison to his season dominance over the Blazers.
Aside from Game 2 when he shot 55 percent from the field his efficiency is glaringly lower. Even including the 55 percent from Game 2 he’s still averaging 35.7 percent which is almost 10 percent less.
His perimeter regression speaks to the shoulder issues with George posting an average of 27.6 percent. That’s a variance of 16.9 percent!
| Rk | Date | MP | FGA | FG% | 3PA | 3P% | FTA | FT% | TRB | AST | STL | PTS | GmSc | +/- |
|---|---|---|---|---|---|---|---|---|---|---|---|---|---|---|
| 1 | 2019-04-14 | 42:54 | 24 | .333 | 15 | .267 | 6 | 1.000 | 10 | 0 | 4 | 26 | 14.2 | 0 |
| 2 | 2019-04-16 | 40:35 | 20 | .550 | 7 | .286 | 4 | .750 | 8 | 3 | 1 | 27 | 16.7 | -11 |
| 3 | 2019-04-19 | 41:12 | 16 | .188 | 7 | .286 | 17 | .824 | 6 | 6 | 1 | 22 | 14.6 | +10 |
Provided by Basketball-Reference.com: View Original Table
Generated 4/21/2019.
Shot attempts and the type of shots George is taking also offer hints the shoulder is a factor. While he averaged over nine attempts from deep in season in the last two games he’s taken seven. However, it’s the free throw attempts which points to George not driving the ball as much, which again, one would presume is because of not wanting his shoulder(s) to get banged up further. Through three games he’s taken 27 free throws for a series average of nine which is well off his season average of 15.5 attempts.
From a production standpoint, his 25 points per game is a full 13 points less than his season average versus the Blazers.
