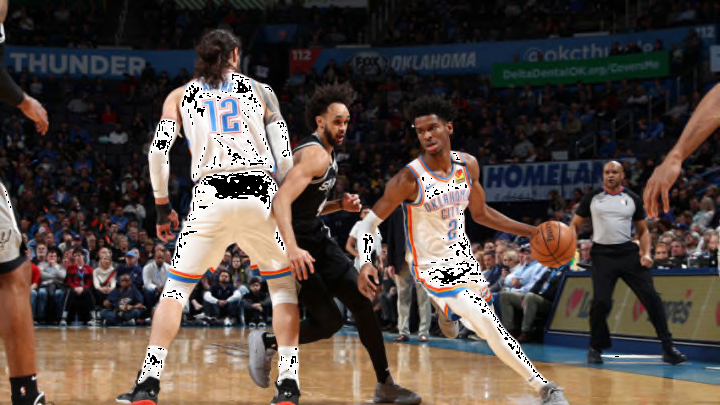
Charlotte Hornets:
Offense: (105.6) tied 25th
Defense: (113.1) 26th
Net: (minus -7.5) 27th
Results Week 17: (2-0) Won vs. Pistons: 87-76, Wolves: 115-108
Games Week 18: (2 games) Thurs at Bulls | Sat vs. Nets
Mitch Kupchak has his work cut out for him this offseason with numerous roster spots to fill. The current crop of youngsters offers a decent core as his starting point. Devonte’ Graham, Miles Bridges, and rookie P.J. Washington are bright spots.
Questions persist regarding Malik Monk who hasn’t nailed down consistent production yet
| Season | G | MP | FGA | FG% | 3PA | 3P% | 2PA | 2P% | FTA | FT% | TRB | AST | STL | PTS |
|---|---|---|---|---|---|---|---|---|---|---|---|---|---|---|
| 2017-18 | 63 | 854 | 17.9 | .360 | 10.2 | .342 | 7.7 | .385 | 1.6 | .842 | 2.8 | 3.8 | 0.8 | 17.7 |
| 2018-19 | 73 | 1258 | 16.8 | .387 | 9.4 | .330 | 7.3 | .461 | 2.9 | .882 | 3.9 | 3.3 | 1.1 | 18.7 |
| 2019-20 | 52 | 1086 | 14.8 | .438 | 6.2 | .285 | 8.7 | .548 | 2.9 | .816 | 4.8 | 3.5 | 0.8 | 17.1 |
| Career | 188 | 3198 | 16.4 | .395 | 8.5 | .323 | 7.9 | .474 | 2.6 | .850 | 3.9 | 3.5 | 0.9 | 17.9 |
Provided by Basketball-Reference.com: View Original Table
Generated 2/19/2020.
Some young players take longer to find their groove, but the concerning part of Monk’s game is his regression in key categories.
The normal box statistics don’t serve up flashing light warnings but the per 36 offers a better comparison of his three seasons. In this campaign, he’s scoring fewer points and taking fewer shots. The shot selection has also switched to more mid-range shots than perimeter attempts and that may be because his efficiency from deep is also regressing by season.
Moving forward the hope will be Monk can rediscover his range and accuracy.
| Season | G | FGA | FG% | 3PA | 3P% | 2PA | 2P% | TRB | AST | STL | BLK | PTS |
|---|---|---|---|---|---|---|---|---|---|---|---|---|
| 2015-16 | 39 | 12.3 | .274 | 3.1 | .222 | 9.1 | .291 | 7.3 | 4.3 | 0.7 | 0.1 | 8.3 |
| 2016-17 | 74 | 11.7 | .367 | 5.1 | .318 | 6.6 | .405 | 6.5 | 3.7 | 1.3 | 0.3 | 11.7 |
| 2017-18 | 80 | 13.9 | .395 | 7.0 | .381 | 6.9 | .410 | 6.5 | 4.0 | 1.4 | 0.3 | 15.7 |
| 2018-19 | 79 | 13.4 | .387 | 6.8 | .353 | 6.6 | .422 | 6.2 | 4.6 | 1.4 | 0.4 | 14.2 |
| 2019-20 | 53 | 15.7 | .418 | 7.1 | .385 | 8.6 | .445 | 4.8 | 4.3 | 1.1 | 0.2 | 18.8 |
| Career | 325 | 13.8 | .391 | 6.5 | .363 | 7.3 | .416 | 6.0 | 4.2 | 1.3 | 0.3 | 15.1 |
Provided by Basketball-Reference.com: View Original Table
Generated 2/19/2020.
The other player who Kupchak may be revisiting is Terry Rozier who was brought in to run the first unit. The interesting part of this equation is while Scary Terry’s shots, points, and efficiencies are up his assists, rebounds and steals are down.
